Example 4: Spectrum Annotation
In this example we will retrieve a spectrum and visualize it, a lot like in example 2.
However, we will not read the spectrum from a file, but retrieve it directly from an online repository.
We will also use Pyteomics to annotate fragment ions. Let’s get to it! Full code can be downloaded
here.
We are going to need spectrum_utils, a library for spectrum processing and visualization. Pyteomics integrates with it and allows to create annotated spectrum plots easily.
First, we use a spectrum’s Universal Spectrum Identifier to download it
directly from the MassIVE repository.
Pyteomics provides tools for that in the pyteomics.usi module.
from pyteomics import pylab_aux as pa, usi
import matplotlib.pyplot as plt
spectrum = usi.proxi(
'mzspec:PXD004732:01650b_BC2-TUM_first_pool_53_01_01-3xHCD-1h-R2:scan:41840',
'massive')
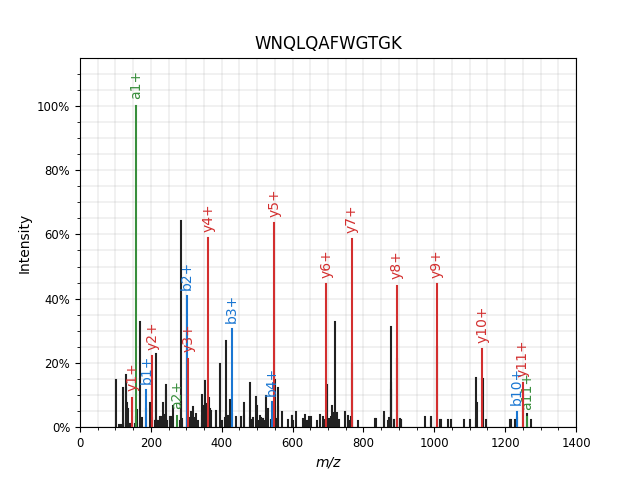
peptide = 'WNQLQAFWGTGK'
Next, just plot the spectrum and annotate it with a single function call:
pa.annotate_spectrum(spectrum, peptide, precursor_charge=2, backend='spectrum_utils',
    ion_types='aby', title=peptide)
plt.show()
You will see a simple spectrum_utils annotation of the spectrum:
pyteomics.pylab_aux.annotate_spectrum() accepts a number of keyword parameters, allowing you to do just about
everything you can do with spectrum_utils.
Note
You can omit backend=’spectrum_utils’, and annotate_spectrum() will use the default backend.
The default backend supports less spectrum preprocessing features.
Another thing spectrum_utils lets you do is mirror plots. Following the spectrum_utils documentation, we are going to make this part more complex, showing more of what you can do. This example includes modified peptides and a bit of spectrum preprocessing. Also, this time we are going to use the spectrum_utils.iplot backend to produce an interactive plot.
To annotate the spectrum of a modified peptide, you can use the ProForma notation, which is the only format supported by spectrum_utils now. You can also use the modX notation which is standard for Pyteomics: it will be converted to ProForma if possible:
from pyteomics import mass
peptide = 'DLTDYLoxMK'  # oxidized methionine
aa_mass = mass.std_aa_mass.copy()
aa_mass['ox'] = 15.9949  # define the mass of the label
Note
In this case, using aa_mass and the modX sequence, Pyteomics will convert it to a ProForma string using
pyteomics.parser.to_proforma():
>>> from pyteomics import parser
>>> parser.to_proforma(peptide, aa_mass=aa_mass)
'DLTDYLM[+15.9949]K'
Going back to our script! Next, we choose two spectra:
usi_top = 'mzspec:MSV000079960:DY_HS_Exp7-Ad1:scan:30372'
usi_bottom = 'mzspec:MSV000080679:j11962_C1orf144:scan:10671'

spectrum_top = usi.proxi(usi_top, 'massive')
spectrum_bottom = usi.proxi(usi_bottom, 'massive')
And finally, produce the image with:
pa.mirror(spectrum_top, spectrum_bottom, peptide=peptide, precursor_charge=2,
    aa_mass=aa_mass, ion_types='aby', ftol=0.5, scaling='root',
    remove_precursor_peak=True, backend='spectrum_utils.iplot'
    ).properties(width=640, height=400).save('mirror.html')
Here’s the result: